Dashboard overview
The Traide dashboard provides a comprehensive view of your marketplace performance. Your home page displays key metrics, sales and order trends, top products, and recent activities to help you manage your marketplace effectively.
Key metrics
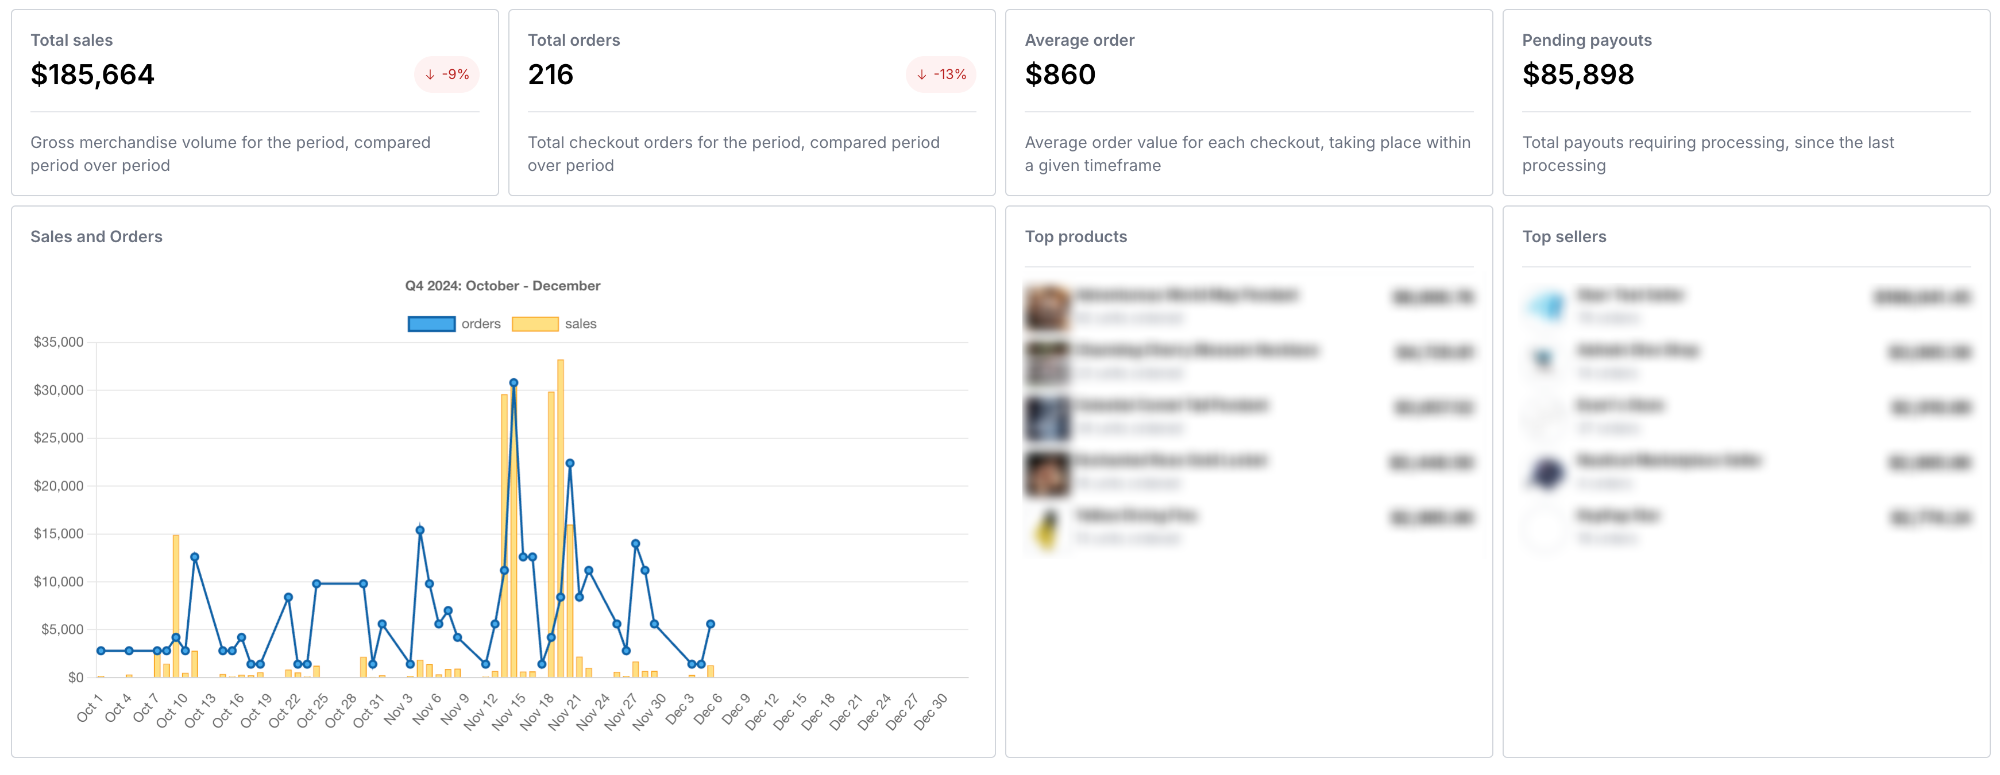
The metrics across the top of the home page show key indicators of your marketplace sales volume and performance. The change indicators compare the current period to the previous period.
- Total sales: Shows the gross merchandise volume for the selected period. This number includes taxes and shipping fees.
- Total orders: Shows the total number of checkout orders for the selected period.
- Average order: Shows the average value of orders during the selected period.
- Pending payouts: Shows the total unprocessed payouts since the last processing cycle.
Sales and orders chart
Check the sales and orders graph to understand trends over time. This graph is a visual representation of sales and orders over the selected period. The yellow bars represent sales volume and the blue lines represent the number of orders.
Top products
The top products card displays the products with the highest gross sales in the selected period.
Top sellers
The top sellers card displays the sellers with the highest gross sales in the selected period.
Quick actions
Use the quick actions section to manage orders, payments, and returns efficiently.
- Orders to fulfill. Number of orders authorized and ready for fulfillment.
- Payments to process. Number of orders fulfilled and ready to capture payment.
- Open quotes. Number of quotes that need action.
- Returns to process. Number of customer return requests that need to be processed.
Recent orders
The recent orders section displays recently placed orders and quotes with details, such as the date and time placed, the status, and the gross total.